Tuning the Application Server
For most peoples needs JBoss would work adequately straight out of the box especially with today's hardware, however there are a number of companies that have large volumes of traffic that require you to tune JBoss to obtain the optimal performance for your application. As I discussed in my Tomcat tuning section performance tuning is a complex area, there are many parts to the equation networking, hardware, application, databases, JVM, etc. There is even a possibility to make the system worse, the best approach to take with tuning is an iterative one, for an example you should use something like below
The two areas that a user is concerned about are
| Response Time | From a users point of view performance is the time it takes to click a page to the time it is displayed (loaded into the browser), how long does it take when you click the button for the page to be returned and displayed. |
| Throughput | Throughput is the number of transactions that can occur in a given amount of time, it is normally measured in transaction per second (tps). |
Before you start to performance tune you should set yourself some goals on what you want to achieve (see below for some idea's), normally these are backed up by an agreement with the business called an SLA (Service Level Agreement), the SLA is a contract to provide a certain level of service between the vendor who's providing the service and the customer, this agreement will define the excepted response times and throughput levels. With this information you then may have a idea on the sort of hardware that many be purchase and how this will fit into your technical architecture.
I am not going to go into too much details here as there are plenty of documents on the internet that do better justice then I can, so what I am going to present is a simple guide on what options are available to tune and some recommendations, but the best source would be the JBoss web site.
We first start with the network card, you need to make sure that these are running at their maximum speed as there are a number of speeds that they can run at, most networks now days should support at least 100MB full-duplex, I point you to my Unix cheat sheet on how to obtain if your network cards have been setup correctly.
Having multiple CPU's in a server obviously gives you better performance, however adding additional CPU's to an existing system many not improve performance, as I noted above there are many parts and the CPU many not be the bottleneck. Having multiple CPU's works well with Java threads, as they don't have to wait for long before getting onto a CPU, however there can be a problem by using too many CPU's for a thread this is called processor affinity
When the processor is executing the thread of a process, the data and the code used by the thread is stored within a cache within the processor. When the thread is interrupted (thread is either blocked while waiting on some i/o or used up its time allotment), another thread runs and starts to overwriting some of that cache code and data. If the cache is large enough there many be a chance that when the thread gets back on the processor that some of the code and data is still there but if the thread is moved to another processor then the thread must fill the cache with the code and data again, remember that accessing the processors cache is many times faster than accessing RAM. So there is a memory latency if the thread is moved from processor to processor, thus you are trying to limit the number of processors that the thread moves hoping that cached data is still there and not over written.
So with the information above the best processor affinity setup would be to allow a thread to run on two - four processors, this does not mean you cannot have a server with 32 CPU's what it means is that a thread will only try and use 4 out of the 32 CPU's on that server, which four is up to the O/S.
There are two JVM's
The difference between them is how they handle compiling Java bytecode into native machine code and how they manage the heap (memory allocation), I will go into more on the heap in a moment. The client is intended for short running programs (Ant) and the server for long-running programs (JBoss). You can choose one to run by using the JAVA_OPTS setting and the -server or the -client option must be the first setting.
| server/client | set JAVA_OPTS=-server %JAVA_OPTS% ... |
The JVM allocates Java objects in an area of memory called the Java heap, what I am about to describe is the Sun's JVM (HotSpot) other JVM's may differ. A Java application will place objects onto the heap, when the application has finished with the object it removes all references to that object, which means the object is now unreachable. When an object becomes unreachable it is deemed as available to the garbage collector, the garbage collector will free up memory by removing any unreachable objects, the garbage collector typically runs when memory resources are low.
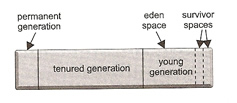
Most JVM objects have a short lifespan and are said to die young, the JVM's heap is divided into several areas, each area is collected individually and each has its own collection algorithms.
| young generation | This area is also know as the eden space as it consists of the young generation space and two survivor spaces called to space and from space. This is were new objects are created. |
| tenured generation | This is the area were objects are moved if they have survived several garbage collections, this is also referred as the old generation. |
| permanent generation | This area holds the class objects which include instances of java.lang.Class and method instances. |
There are a number of JVM heap sizing arguments that you can supply
| Argument | Description | Notes |
| -Xms<size> | Sets the minimum heap size | In production you should set the min and max the same |
| -Xmx<size> | Sets the maximum heap size | |
| -XX:NewSize=<size> | Sets the minimum young generation size | In production you should set the min and max the same |
| -XX:MaxNewSize=<size> | Sets the maximum young generation size | |
| -XX:NewRatio=<number> | Sets the ratio of the size of the young generation as compared to the tenured generation | Use either the NewSize/MaxSize arguments or the NewRatio argument but not both. |
| -XX:SurvivorRatio=<numbers> | Sets the ratio of the size of the eden space compared to one survivor spaces | vary the ratio based on the young generation size, a ratio of 8 for small young generations (10MB) and 32 for larger ones (100MB) |
| -XX:=+UseTLAB | provides each thread in the application with its own allocation area (thread-local allocation block (TLAB)). Options are + (on) or - (off) | Mainly benefits multiprocessor systems |
| -XX:TLABSize=<size> | The size of each TLAB | Make sure the young generation is large enough to hold all the TLABs for each thread (try 64K, 128K, 256K) |
| -XX:MaxTenuringThreshold=<number> | Indicates the number of minor collections that an object must survive before being automatically placed in the tenured generation | Usually you should use a value of 32 |
| -XX:MaxPermSize=<size> | Sets the size of the permanent generation | Don't set this unless you run out of space |
There is a recommendation that you should set the min and max size of the heap to the same, the reason behind this is that if the values are different the JVM takes away time from processing the application to determine if it should adjust the sizes after garbage collection, this also applies to the young generation sizes, also it is recommended that the young generation size should be one-third to one-quarter the size of the heap. An example of adjusting the memory is below, I suggest you play around with your settings to obtain the optimal setting, how do you now when they are optimal well keep read and all will be explained later.
| JAVA_OPTS memory example | set JAVA_OPTS=%JAVA_OPTS% -Xms1200m -XX:NewSize=400m -XX:MaxNewSize=400m -XX:SurvivorRatio=32 -XX:+UseTLAB -XX:TLABSize=64k |
There are two categories of garbage collection
When the young generation is collected, all objects still in use are moved to the survivor space (to space), these objects are said to be alive and objects no longer in use are dead. After the collection the eden space and survivor space (from space) are empty. If the to space fills up during the collection any excess surviving objects are placed in the tenured generation, also any objects that have survived several minor collections are also placed into the tenured generation. Once the collection is finished the eden space and the from space are empty and within the young generation space only the to space contains in-use objects, At this point in time, the from space and the to space change destinations because after the collection the to space is always empty.
Before a minor collection the JVM looks at the tenured generation and determines if there's ample space to hold any objects from the young generation that overflow into the tenured generation, if not, then it performs a collection on the tenured generation first, this is known as a full collection, the tenured generation is also compacted moving all the objects to one end of the tenured generation space.
There are two collector types
By default if the server has multiple processors and at least 1GB of memory the JVM turns on UseParallelGC automatically for the serial collector, the JVM uses one collector thread for every processor on the server. The arguments that you can use are the following
| Collector Type | Argument | Parallel collection |
| Serial | <none, the default> | -XX:+UseParallelGC |
| Concurrent | -XX:+UseConcMarkSweepGC | -XX:+UseParNewGC |
You can also adjust the number of threads using the -XXParallelGCThreads option.
To gather garbage collection data you can use a number of parameters
| -verbose:gc | Generates basic garbage collection stats - heap size before and after, time spent in collection | does not show any statistics for the concurrent collector |
| -XX:+PrintGCDetails | Adds data about the young generation size to that provided by verbose:gc | shows concurrent collector data |
| -XX:PrintHeapAtGC | Generates detailed garbage collection statistics - size and percent usage of each heap space, along with heap memory addresses, before and after each collection | Provides details on the various phases of a concurrent collection |
| -XX:+PrintGCTimestamp | Prints the seconds that have elapsed since the start of the application | Use in conjunction with the other print options |
| -Xloggc:<filename> | Garbage collection statistics are placed into the file indicated by <filename> | If not specified, the collection statistics are sent to standard. |
I will leave you to investigate the log files, but here is a Java program (but you can use what ever you want) that you can use to put the data and into a CVS file that excel can chart.
| log analyzer | import java.io.*; |
| Resulting file | 60176,56377,0.0050069 60473,56675,0.0049446 60771,13067,0.1216777 |
| Plot the excel graph |
|
The type of graph you are looking for is one that starts performing garbage collections but then progresses into a smooth line (see below diagram).
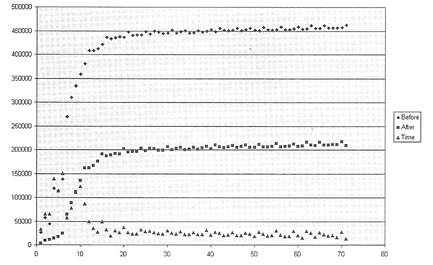
You are trying to achieve the following by adjusting the heap sizes, be careful making the heap size to large, as this will make garbage collection take longer (could take 20mins if you set it to 20GB), try to make the size just enough. You are trying to archive the following
There are some more tuning parameters that you can use relating to the JVM
| -XX:+USESSPINNING | when this option is set, If a thread finds that a resource it requires is locked, the thread goes into a busy wait (a tight loop) for a brief period to see if the resource becomes free instead of giving up the processor. |
| -DSUN.RMI.DGC.CLIENT.GCINTERVAL=<int> -DSUN.RMI.DGC.SERVER.GCINTERVAL=<int> |
When using RMI, the JVM performs a full collection every 60 seconds to free up any remote objects. Feel free to adjust these |
| -XX:+DISABLEEXPLICITGC | This option forces the JVM to ignore calls to the System.gc() method |
There are several things that can be tuned in JBoss, some affect all applications other only affect applications that many use a particular service.
JBoss maintains a pool of database connections which are used by the application, in the *-ds.xml file you can specify information about the pool size, try not to set a too high value as each connection uses systems resources which are wasted if you are not using them.
| Option | Default |
Description |
| <min-pool-size> | 0 |
The minimum number of connections maintained to the database |
| <max-pool-size> | 20 |
The maximum number of connections maintained to the database |
| <blocking-timeout-millis> | 30 sec |
The amount of time a thread waits on a connection if all connections are in use and the maximum connections have been allocated |
| <idle-timeout-minutes> | 0 |
The amount of time the application server waits before deallocating a connection that's no longer needed |
There is a way to monitor the database connection pool usage, when a datasource is deployed the application server creates three MBeans, one of which manages the connection pool
| connection pool manager MBean | Jboss.jca:name=<dsname>,service=ManagedConnectionPool |
Key connection pool MBean properties |
|
| ConnectionCount | The number of connection to the database |
| AvailableConnectionCount | The number of database connections not allocated to a request |
| MaxConnectionInUseCount | The largest number of database connections ever allocated to requests |
| InUseConnectionCount | The number of database connections allocated to requests |
| ConnectionCreatedCount | The total number of connections created by the application server, this this becomes to high then increase <min-pool-size> and <idle-timeout-minutes> |
| ConnectionDestroyCount | The total number of connections closed by the application server, this this becomes to high then increase <min-pool-size> and <idle-timeout-minutes> |
Another configuration option regarding the data source is the prepared statement cache, this cache holds the recently used prepared statements in case they are used again.
| Option | Default |
Description |
| <prepared-statement-cache-size> | 0 |
The number of prepared statements to hold in the cache |
| <shared-prepared-statement> | false |
If a request creates the same prepared statement more than once in a given request, should the same prepare statement object be used? you can get unintended results using the same prepare statement so be careful |
You can also tune the HTTP request pool and I point you to the topic configuring connectors for more information on this.
The server/xxx/deployers/jbossweb.deployer/web.xml file contains initialization parameters for the JSP servlet, I have listed some of the parameters that you can change to increase performance
| Parameter | Default |
Description |
| development | True |
If true then the application server checks to see if the JSP has been updated using the modification text interval, if false changed JSPs are compiled in the background using check interval |
| checkInterval | 0 |
The number of seconds between checks to see if any JSPs need to be recompiled, if 0 the JSPs are never checked for changes or recompiled Used when development is false. |
| modificationTestInterval | 4 |
The number of seconds to wait before the JSP is checked for updates, if 0 the JSP is checked each time its accessed. Used when development is true |
| genStrAsCharArray | False |
Generates strings as character arrays, under some circumstances can improve performance |
| trimSpaces | False |
Removes extraneous white space from the resulting HTML text, decreasing the size of the response sent back to the client. |