Performance Testing
From a users point of view performance is the time it takes to click a page to the time it is displayed (loaded into the browser), from an administrator point of view there are two important properties that you should measure for quantifying the performance of a web site
Response time is what I explained above, how long does it take when you click the button for the page to be returned and displayed. Throughput is the number of transactions that can occur in a given amount of time, it is normally measured in transaction per second (tps).
Before you start your web application design, you send set some goals on what you what to achieve
Having an idea on what to expect will given you an idea on what hardware and software to buy
Scalability and Performance
The goal of load testing is to determine both the performance and salability of a Web application. Scalability is what the system can handle when an increased load is applied without any severe degradation of performance. There will be a point that even the best system will degrade if a bigger enough load is applied to it, what you need to know is when is that point. There are two ways to add scalability
Again this should be thought of at the design stage, make sure that the servers have room to expand (capable to add more CPU's and memory).
There are three testing categories
In load testing the application is subjected to a "normal" amount of load, you would start testing with a low number of users then increase to a high number of users, during this you record response times and throughput and at the end of the test you should have an idea on what your application is capable of.
The object of stress testing is simply to break the system by applying unreasonable load and keep increasing until something breaks, what you are looking for is
The bugs could identified what problems you face are a system crash, like database problems, transaction problems, etc.
In the continuous hours of operation you leave your web applications running for a few days to simulate the real world, again your goal is to obtain response time and throughput data, this type of testing will hopefully catch any remaining problems that the first two tests did not pick up, for example memory leaks within the application, application code errors, reporting problems, batch problems.
In order to achieve the above you need lots of users using your web application, which is normally impractical (due to costs), so what you need is a tool that can do the job for you. There are a number of performance measurement tools around
One mistake when performance testing is that you make to many changes in one go, thus not fully understanding which one made a performance impact (for good or for bad). Performance testing is a slow and time consuming process, what you hoping to get out of it is a baseline performance that your application can achieve.
JMeter is a free load testing tool and is part of the Apache project, you can even load test FTP, JDBC, data sources and Java Objects. JMeter has many features
JMeter runs in three modes
JMeter interface consist of of tree pane (left) and a output/configuration pane (right), At the heart is a test plan which is a list of actions to perform. You add elements to the test plan by right clicking on the test plan. The workbench is a container for test elements that are not yet part of the test plan this is idea to move configurations back and forth in the test plan. I will now walk you through creating a very simple example to test the cluster solution I created in another topic.
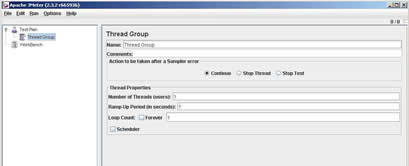
Right click the test plan and select "add->thread group", the thread group configuration window will appear in the right pane. The thread group is basically your users, you can fill in the following fields
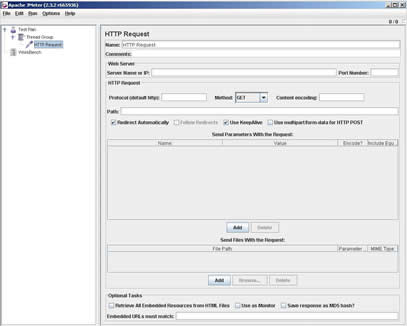
Once you have a thread group to need it to do something, in this case a HTTP request, right-click on the thread group and select "add->Sampler->HTTP Request". Now you will have the HTTP request window in the right pane, the obvious ones i am not going to list
I have a tutorial regarding HTTP methods and general servlet information in my JSP tutorial, if you wish to dive deeper.
Now you have a thread group and added a action to the group, you need to obtain the results, we need to attach a listener to the thread group, this listener will capture the results and display them how you want, there are a number of listeners
To attach a listener right-click the thread group and select "add->Listener->View Results Tree" , you now have it setup like below
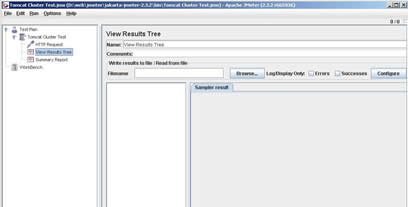
You are now ready to pound you web application, to do this select the "run" field at the top and then select "start", click on the "view results tree" and you should start to see some output being captured.
When you are loading testing the server, you probably need to get a number of team members in involved to capture the statistics of each component within your application, Unix admin, DBA, Network Admin, etc.
I will leave you now to play around with JMeter and to search for documents on the internet, performance testing is a vast subject and it is better for me to introduce to a sample of what can be achieve.